- Thumbnail
- Resource ID
- 1c64fbb4-6b6e-11e9-8d7d-000d3ab6a624
- Title
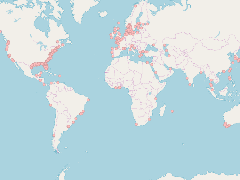
- hypoxia hotspots (1985-2000)
- Date
- April 30, 2019, 12:33 p.m., Publication
- Abstract
- This layer represents 479 sites identified as experiencing hypoxia, 55 sites that once experienced hypoxia but are now improving, and 228 sites that experience other symptoms of eutrophication, including algal blooms, species loss, and impacts to coral reef assemblages.
These data were compiled using a literature search conducted by Dr. Robert Diaz of VIMS and WRI staff. Because this map depends on available data, geographic areas with more data availability (such as the United States) may show relatively more problem areas compared to areas with less data.
- Edition
- --
- Owner
- Global_Nutrient_Cycle
- Point of Contact
- Purpose
- --
- Maintenance Frequency
- notPlanned
- Type
- vector
- Restrictions
- None
- License
- Not Specified
- Language
- eng
- Temporal Extent
- Start
- --
- End
- --
- Supplemental Information
- No information provided
- Data Quality
- --
- Extent
-
- long min: -158.0070000000
- long max: 168.0000000000
- lat min: -46.9200000000
- lat max: 68.4177090000
- Spatial Reference System Identifier
- EPSG:4326
- Keywords
- no keywords
- Category
- Oceans
- Regions
-
Global